Autobox Blog

Thoughts, ideas and detailed information on Forecasting.

  • Home
    Home This is where you can find all the blog posts throughout the site.
  • Categories
    Categories Displays a list of categories from this blog.
  • Tags
    Tags Displays a list of tags that has been used in the blog.
  • Bloggers
    Bloggers Search for your favorite blogger from this site.
Subscribe to this list via RSS Blog posts tagged in forecasting daily monthly weekly holidays

IBM released version SPSS Modeler 18 recently and with it a 30 day trial version.

We tested it and have more questions than answers. We would be glad to hear any opinions(as always) differing or adding to ours.

There are 2 sets of time series examples included with the 30 day trial.

We went through the first 5 "broadband" examples that come with the trial that are set to run by default.  The 5 examples have no variability and would be categorized as "easy" to model and forecast with no visible outliers. This makes us wonder why there is no challenging data to stress the system here?

For series 4 and 5 both are find to have seasonality.  The online tutorial section called "Examining the data" talks about how Modeler can find the best seasonal models or nonseasonal models.  They then tell you that it will run faster if you know there is no seasonality.  I think this is just trying to avoid bad answers and under the guise of it being "faster". You shouldn't need to prescreen your data.  The tool should be able to identify seasonality or if there is none to be found.  The ACF/PACF statistics helps algorithms(and people) to help identify seasonality.  On the flipside, a user may think there is no seasonality in there data when there actually is so let's take the humans out of the equation.

The broadband example has the raw data and we will use that as we can benchmark it.  If we pretend that the system is a black box and just focused on the forecast, most would visually say that it looks ok, but what happens if we dig deeper and consider the model that was built? Using simple and easy data avoids the difficult process of admitting you might not able complicated data.

The default is to forecast out 3 periods.  Why? With 60 months of data, why not forecast out at least one cycle(12)?  The default is NOT to search and adjust for outliers.  Why? They certainly have many varieties of offerings with respect to outliers, but makes me wonder if they don't like the results?  If you enable outliers only "additive" and "level shift" are used unless you go ahead a click to enable "innovational", "transient", "seasonal additive", "local trends", and "additive patch". Why are these not part of the typical outlier scheme?

When you execute there is no audit trail of how the model go to its result. Why?

You have the option to click on a button to report "residuals"(they call them noise residuals), but they won't generate in the output table for the broadband example.  We like to take the residuals from other tools and run them in autobox.  If a mean model is found then the signal has been extracted from the noise, but if Autobox finds a pattern then the model was insufficient...given Autobox is correct. :)

There is no ability to report out the original ACF/PACF being reported. This skips the first step for any statistician to see and follow why SPSS would select a seasonal model for example 4 and 5.  Why?

There are no summary statistics showing mean or even number of observations. Most statistical tools provide these so that you can be sure the tool is in fact taking in all of the data correctly.

SPSS logs all 5 time series. You can see here how we don't like the kneejerk movement to use logs.

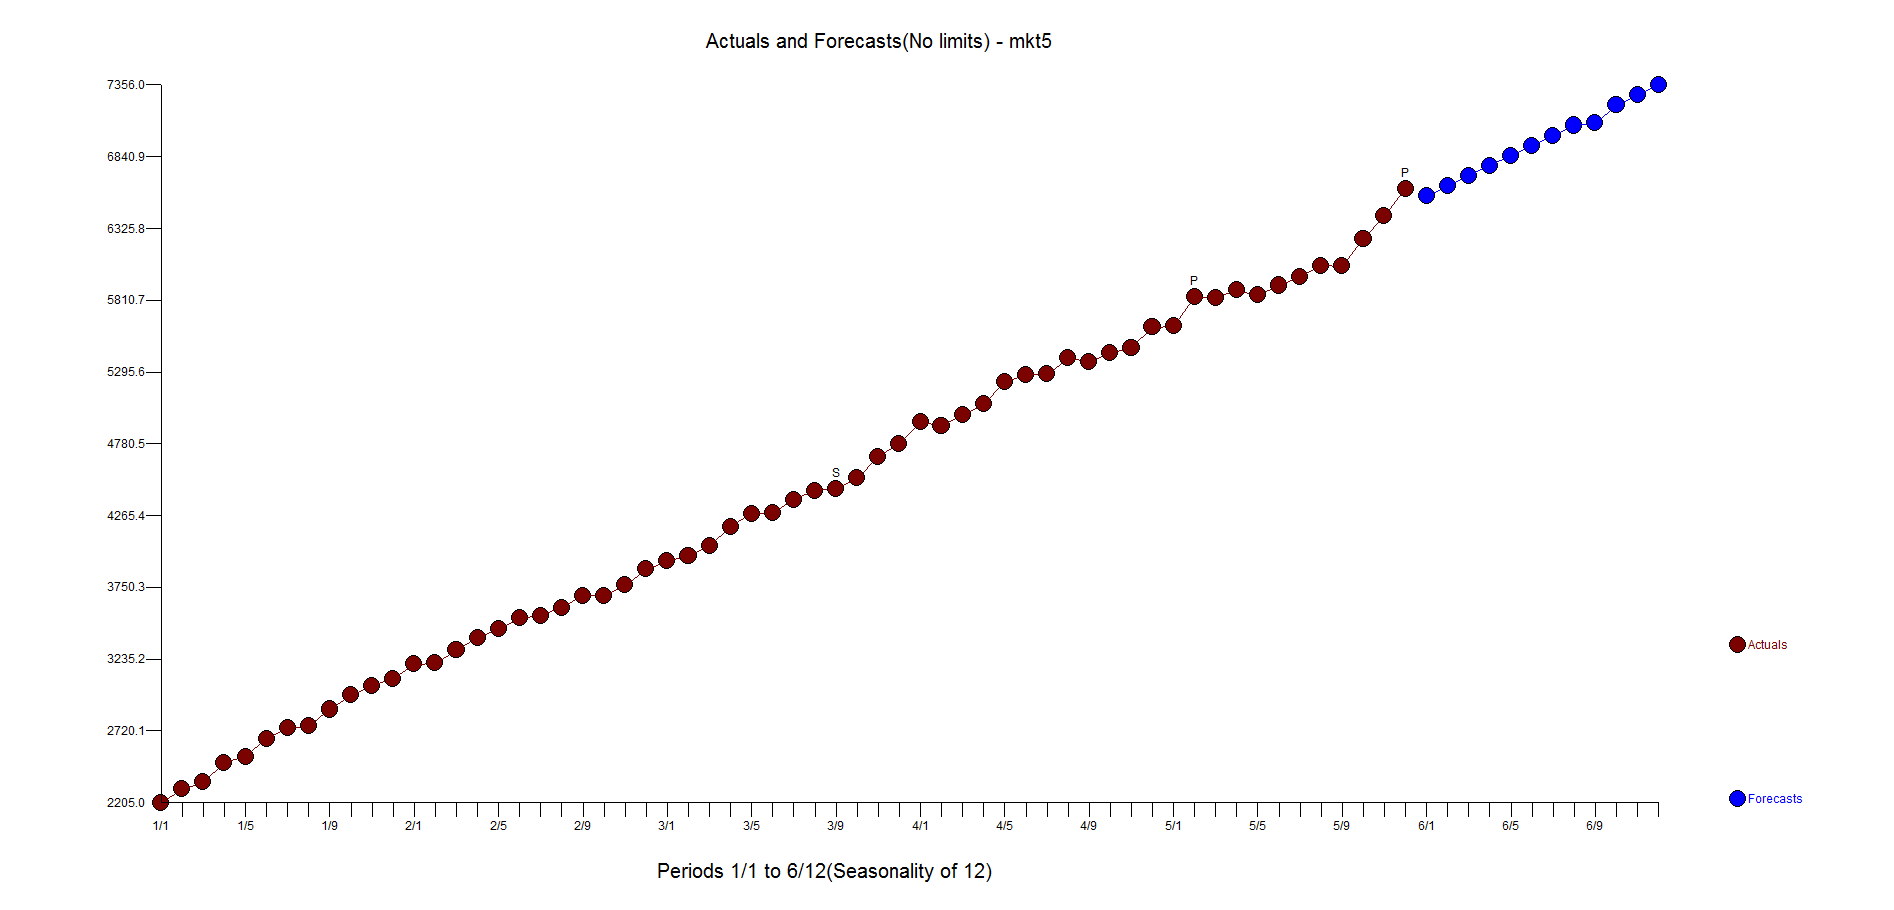
We don't understand why differencing isn't being used by SPSS here. Let's focus on Market 5. Here is a graph and forecast from Autobox 


Let's assume that logs are necessary(they aren't) and estimate the model using Autobox and auto.arima and both software uses differencing. Why is there no differencing used by SPSS for a non-stationary series? This approach is most unusual. Now, let's walk that back and run Autoboc and NOT use logs and differencing is used with two outliers and a seasonal pulse in the 9th month(and only the 9th month!). So, let's review. SPSS finds seasonality while Autobox & Auto.arima don't.

How did SPSS get there? There is no audit of the model building process. Why?

We don't understand the Y scale on the plots as it has no relationship to the original data or the logged data.

The other time series example is called "catalog forecast". The data is called "men". They skip the "Expert modeler" option and choose "Exponential Smoothing". Why?

This example has some variability and will really show if SPSS can model the data. We aren't going to spend much time with this example. The graph should say it all. Autobox vs SPSS

The ACF/PACF shows a spike at lag 12 which should indicate seasonality. SPSS doesn't identify any seasonality. Autobox also doesn't declare seasonality, but it does identify that October and December's do have seasonality (ie seasonal pulse) so there is some months which are clearly seasonal. Autobox identifies a few outliers and level shift signifying a change in the intercept(ie interpret that as a change in the average).

If we allow the "Expert Modeler", the model identified is a Winter's additive Exponential smoothing model.

We took the SPSS residuals and plotted them. You want random residuals and these are not it. If you mismodel you can actually inject structure and bias into the residuals which are supposed to be random. In this case, the residuals have more seasonality(and two separate trends?) due to the mismodeling then they did with the original data. Autobox found 7 months to be seasonal which is a red flag.

I think we know "why" now.


The most studied time series on the planet would have to be the Box-Jenkins International Airline Passenger series found in their 1970 landmark textbook Time Series Analysis: Forecasting and Control.  Just google AirPassengers or "airline passenger arima" and you will see it all over the place. It is on every major forecasting tool's website as an example.  It is there with a giant flaw.  We have been waiting and waiting for someone to notice.  This example has let us known (for decades) that we have a something that the others don't...robust outlier detection.  Let's explore more on why and how you check it out yourself.

It is 12 years of monthly data and Box-Jenkins used Logs to adjust for the increasing variance.  They didn't have the research we have today on outliers, but what about everyone else?  I. Chang had an unpublished dissertation(look for the name Chang) at University of Wisconsin in 1982 laying out an approach to detect and adjust outliers providing a huge leap in modeling power.

It was in 1973 that Chatfield and Prothero published a paper where the words "we have concerns" regarding the approach Box-Jenkins took with the Airline Passenger time series.  What they saw was a high forecast that turned out to be too aggressive and too high.  It is in the "Introduction" section. Naively, people think that when they take a transformation and make a forecast and then inverse transform of the forecast that they are ok. Statisticians and Mathematicians known that this is quite incorrect.  There is no general solution for this except for the case of logarithms which requires a special modification to the inverse transform. This was pointed out by Chatfield in his book in 1985.  See Rob Hyndman's discussion as well.

We do question why software companies, text books and practitioners that didn't check what assumptions and approaches that previous researchers said was fact. It was "always take Logs" for the Airline series and so everyone did.  Maybe this assumption that it was optimal was never rechecked?  I would imagine with all of the data scientists and researchers with ample tools would have found this out by now(start on page 114 and read on---hint:you won't find the word "outlier" in it!). Maybe they have, but haven't spread the word?  We are now. :)

We accidently discovered that Logs weren't needed when we were implementing Chang's approach.  We ran the example on the unlogged dataset and noticed the residuals variance was constant.  What?  No need to transform??

Logs are a transformation.  Drugs also transform us.  Sometimes with good consequences and sometimes with nasty side effects.  In this case, the forecast for the Passenger was way too high and it was pointed out but went largely unnoticed(not by us).

Why did their criticism get ignored or forgotten?  Either way, we are here to tell you that across the globe in schools and statistical software it is repeating a mistake in methodology that should be fixed.

Here is the model that Autobox identifies.  Seasonal Differencing, an AR1 with 3 outliers.  Much simpler than the Regular, Seasonal Differencing, MA1, MA12 model ....with a bad forecast.  The forecast is not as aggressive.  The outlier in March 1960 is the main culprit(period 135), but the others are also important. If you limit Autobox to search for one outlier is finds the 1960 outlier, but it still uses Logs so you need to "be better". It caused a false positive F test that logs were needed.  They weren't and aren't needed!


The Residuals are clear of any variance Trend.


Here is a Description of the Possible Violations of the Assumptions of Constancy of the Mean and Variance in Residuals and How to Fix it.


Mean of the Error Changes: (Taio/Box/Chang)

1. A 1 period change in Level (i.e. a Pulse )

2. A contiguous multi-period change in Level (Intercept Change)

3. Systematically with the Season (Seasonal Pulse)

4. A change in Trend (nobody but Autobox)

Variance of the Error Changes:

5. At Discrete Points in Time (Tsay Test)

6. Linked to the Expected Value (Box-Cox)

7. Can be described as an ARMA Model (Garch)

8. Due to Parameter Changes (Chow, Tong/Tar Model)


SAP has a webpage with a tutorial on using their Predictive Analytics 2.3 tool(formerly KXEN Modeler)using daily data.  They released this back in December, but didn't see until browsing Twitter. It provides an unusual public record of what comes out of SAP. They didn't publish the model with p-values and all of the output, but this is good enough to compare against.  We ran numerous scenarios with different modeling options to understand what the outcome would be using these modeling(ie variable) techniques.  Autobox has some default variables it brings in with daily data.  We will have to suppress some of those features so that when we use the SAP variables they don't collide with them and make a multicollinear regression.

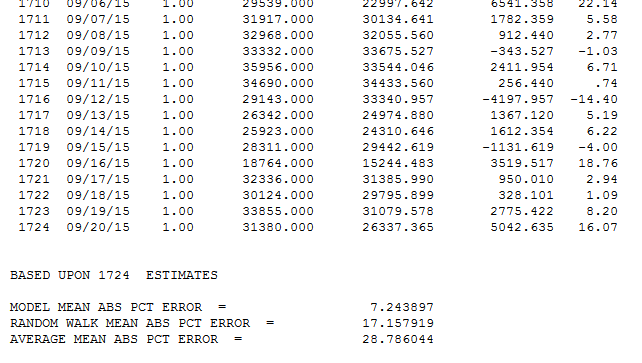
The Tutorial is well written and allows you to easily download the 1,724 days of data and model this yourself. While SAP had a .13 MAPE(in sample), they had a challenge at the end for those who get a MAPE less than .12 to contact them.  Can you predict what Autobox did? .0724.  Guess who is going to contact them? I will also add, that if you can do better contact us as we might have something to learn too.  I also suggest that you post how other tools handle this as well as that would be interesting to see as well. Autobox thrives(1st among automated) on daily data as it did in a daily forecasting competition and is much more difficult to model and something we have dedicated 25 years to perfecting.

After reading the SAP user's guide let's make the distinction that Autobox uses all of the data to build the model, while SAP (like all other tools) withholds data to "train" on.

Autobox adjusts for outliers. One could argue that by using adjusting for outliers the MAPE will only go down which is true, but it be aware that it allow for a clearer identification of the relationships in the data( ie coefficients / separating signal from noise).

The first approach in the SAP tutorial is running with only historical data and they add in the causals later. Outliers are identified and has a MAPE of .197.

66 Variables

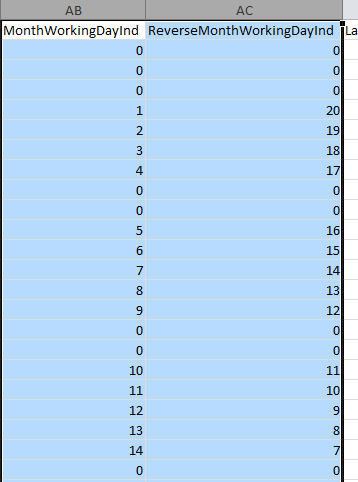
A bunch of very curious variables(66??----PenultimateWednesday) are included that we have never seen before which made us scratch our heads (with delight???). They seem to try and capture the day of the week so we will turn that off some of Autobox's searches to avoid collinearity when we run with these in the first pass. They seem to use a day of year variable which I have never seen before. What book are they getting ideas to use these kind of variables from? Not one that I have ever seen, but perhaps someone can enlighten me? There are two variables that are measuring the number of working days that have occurred in the month and the number left in the month. We did find that some of these variables do have importance in the tests we ran so SAP has some ideas generating useful variables, but many are collinear and this could be called "kitchen sink" modeling. We will do more research into these. There is a holiday variable which also flags working days so the two variables would seem to be collinear. These two end up as the second and third most powerful variables in the SAP model. When we tried these in Autobox, both runs found them significant. Perhaps they measure (implicitly) holidays too? We are not sure, but they help.
 

There are weather variables which are useful and actually represent seasonality so using both monthly dummies/weekly dummies and the weather variables could be problematic. The holidays have been all combined into one catch all variable. This assumes that each holiday behaves similarly. It should be noted that a major difference is that SAP does not search for lead or lag relationships around the causals while Autobox can do that. Just try running this example in Autobox and then SAP. We ran with all of these curious variables. We then reduced these variables and kept only Holiday, gust, rain, tmean, hmean, dmean, pmean, wmean, fmean, TubeStrike and Olympics and removed the curious other variables. The question which might arise "how much can you trust the weather predictions?", but here we are looking at only the MAPE of the fit so that is not a topic of concern.

SAP ended up with a .13 MAPE when using there long list of causals. The key here is that no outliers are identified in the analysis. This is a distinction and why Autobox is so different. If you ignore outliers they do still exist and yes they exist in causal problems. By ignoring something that doesn't mean it goes away, but ends up impacting you elsewhere such as the model and you likely aren't even aware of its impact. By not being able to deal with outliers your model with causals will be skewed, but no one talks about this in any school or text book so sorry to ruin this illusion for you. Alice in Wonderland(search on alice) thought everything was perfect too, until.....

Autobox does stepdown regression, but also does "stepup" where it will search for changes in seasonality(ie day of the week), trend/level/parameters/variance as things sometimes drastically change. If you're not looking for it then you will never find it! s. The MAPE we are presenting can be found in the detail.htm audit report from the Autobox run(hint:near the bottom). We suppressed the search for special days of the month which are useful in ATM data, but not theoretically plausible for this data. Autobox allows for holidays in the Top 15 GDP's, but in general assumes the data is from the US so we will need to suppress that search. We suppressed the search for special days of the month which are useful in ATM daily data as payday's are important, but not theoretically plausible for this data.

To summarize: We can run this a few different ways, but we can't present all of these results down below as it would be too much information to present here. We included some output and the Autobox file (current.asc-rename that if you want to reproduce the results) so you can see for yourself. What we do know is that including ARIMA increases run time.

MAPE's

  • Run using all variables with Autobox default options(suppressing US Holidays, day of month and monthly/weekly dummies). .0883
  • Run using all variables with Autobox default options(suppressing US Holidays, day of month and monthly/weekly dummies). Allow for ARIMA .0746
  • Run using a reduced set of variables(see above) & suppressing US holidays, day of month and monthly/weekly dummies). .1163
  • Run using a reduced set of variables(see above) & suppressing US holidays, day of month and monthly/weekly dummies). Allow for ARIMA .0732
  • Run using only Holiday, Strike/Olympics and rely upon monthly or weekly dummies. .1352
  • Run using only Holiday, Strike/Olympics and rely upon monthly or weekly dummies. Allow for ARIMA .1145
  • Run using a reduced set of variables, but remove the catch all "holiday" variable and create separate 6 main holiday variables that were flagged by SAP as they might each behave differently. (suppressing US Holidays, day of month, and monthly/weekly dummies) .1132
  • Run using a reduced set of variables, but remove the catch all "holiday" variable and create separate 6 main holiday variables that were flagged by SAP as they might each behave differently. (suppressing US Holidays, day of month, and monthly/weekly dummies). Allow ARIMA .0724

Let's consider the model that was used to develop the lowest MAPE of .0724.

There were 38 outliers identified over the 1,724 observations so the goal is not to have the best fit, but to model and be parsimonious.

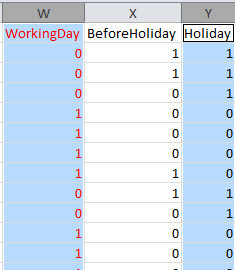
So, what did we do to make things right?  We started by deleting all kinds of variables.  There were linearly redundant variables such as WorkingDay that is perfectly correlated (inverse here) to Holiday which by definition should never be done when using dummy variables. The variable "Special Event" is redundant with TubeStrike and Olympics as well.  Special Event name isn't even a number, but rather text and also is redundant.
All other software withholds data whereas Autobox uses all of the data to build the model as we have adaptive technology that can detect change (seasonality/level/trend/parameters/variance plus outliers). We won best dedicated forecasting tool in J. Scott Armstrong's "Principles of Forecasting".  For the record, we politely disagree against a few of the 139 "Principles" as well.

We report the in sample MAPE, in the file "details.htm" seen below...


Another way to compare the Autobox and SAP results are by comparing side by side the actual and fit and you will clearly see how Autobox does a better job. The tutorial shows the graph for univariate, but unfortunately not for the causal run!  Here is the graph of the actual, fit and forecast. 
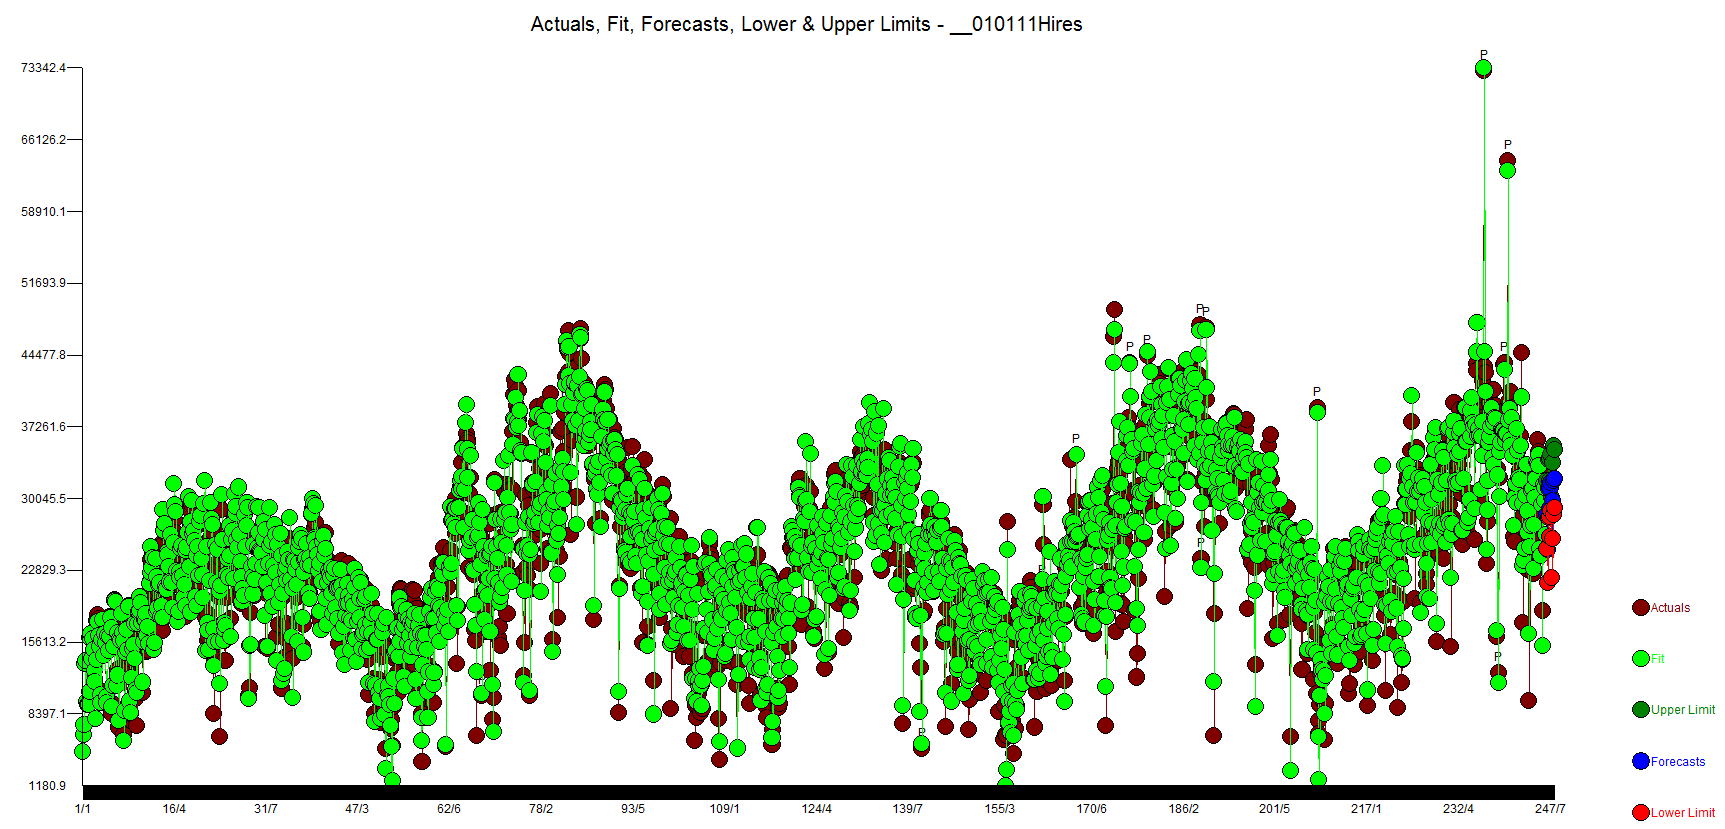
 

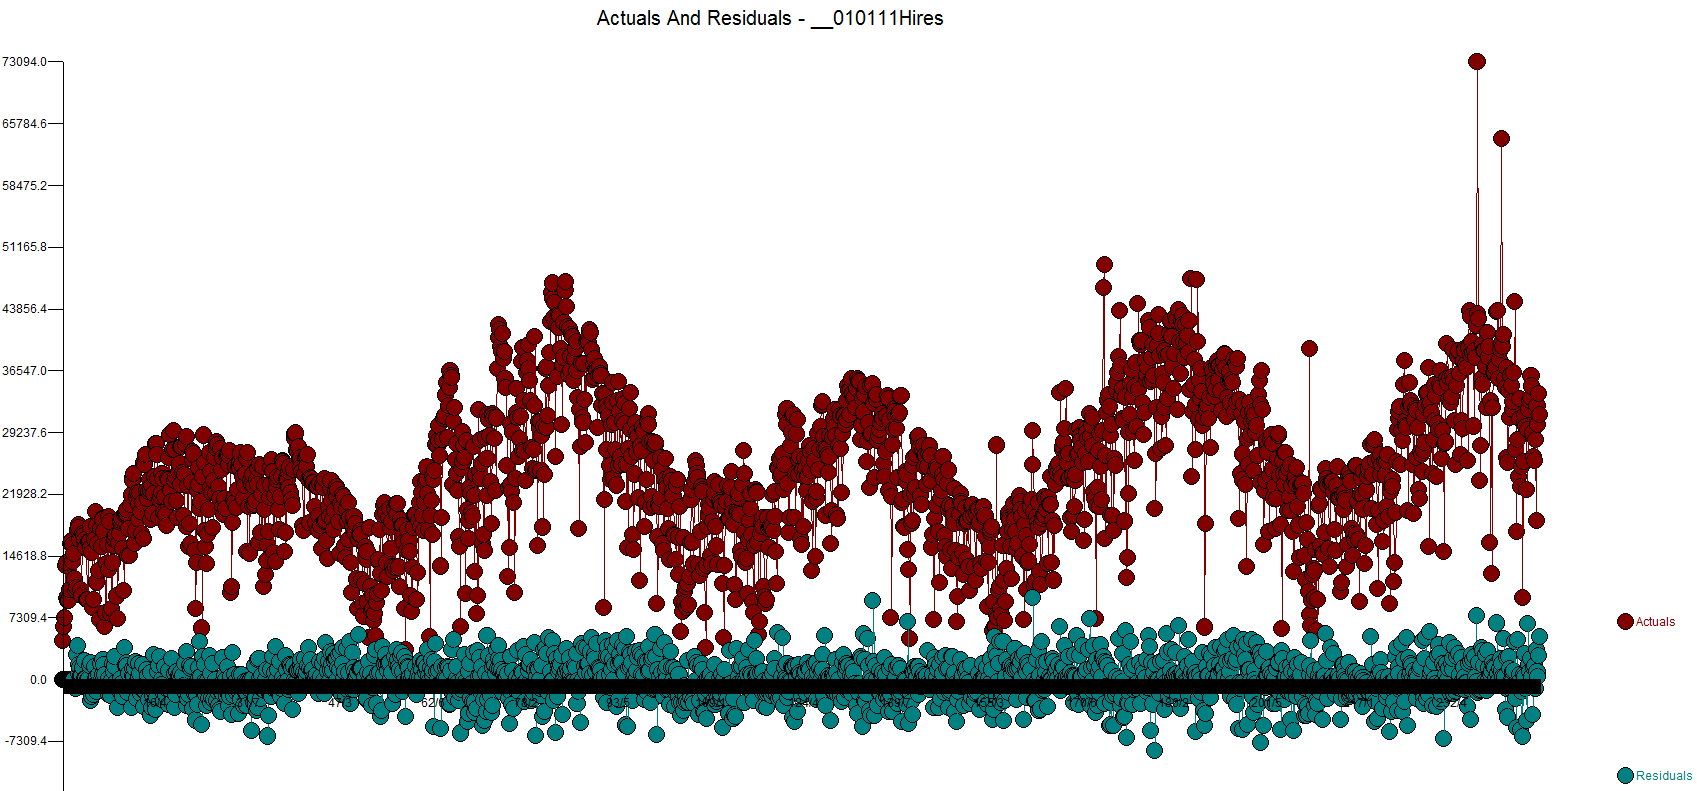
We prefer the actual and residuals plot as you can see the data more clearly.
 

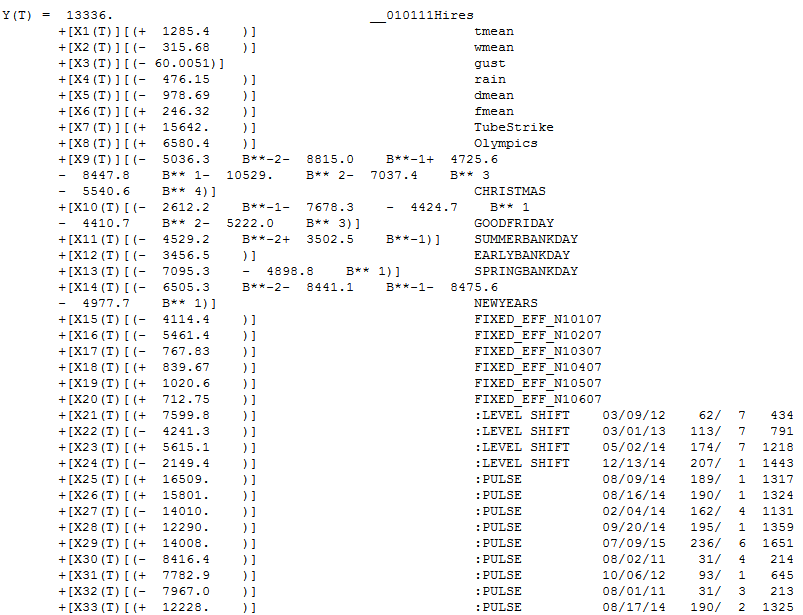
Let's review the model

The sign of the coefficients make sense(for the UK which is cold).   When it's warmer people will skip the car and use the bike, for example so when Temperature goes up (+ sign) then people rent more bikes. When its gusty people will not and just drive. The tutorial explains the variables names in the back. tmean is average temperature,  w is wind,  d is dewpoint, h is humidity, p is barometric pressure, d is real feel temperature.   All 6 holidays were found to be important with all but one having lead or lag impacts.  When you see a B**-2 that means two days before the Christmas volume was low by 5036. Autobox found all 6 days of the week to be important.  The SAP Holiday variable was a mixture of Saturday and Sunday and causes some confusion with interpretation of the model.  This approach is much cleaner.  The first day of the data is a Saturday(1/1/2011) and the variable "FIXED_EFF_N10107" is measuring that impact that Saturday is low by 4114. Sunday is considered average as day 7 is the baseline.  See below  for more on the day of the week rough verification(ie pivot table/contribution %).

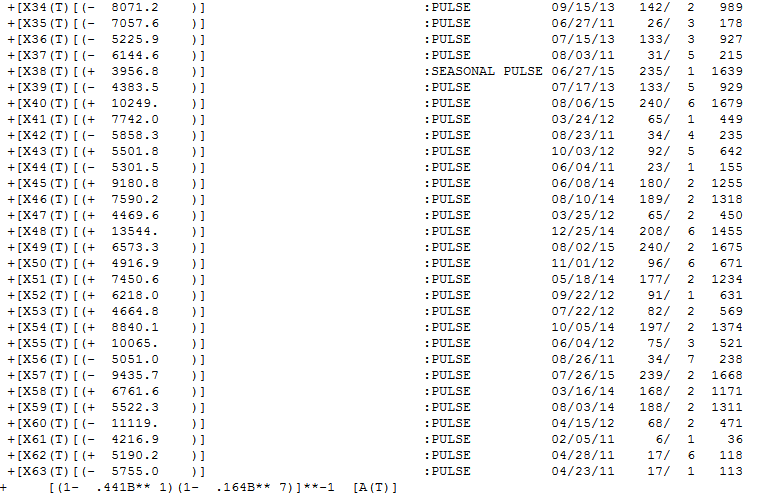
Note the "level shift' variables added to the model. This meant that the volume changed up or down for a period and Autobox identified and ADAPTED to it. We call this "step up regression"(nothing there right? Yes, we own that world!) as we are identifying on the fly deterministic variables and adding them to the model. The runs with the SAP variables fit 2012 much better. The first time trend began at period 1 with volume steadily increasing 10.5 units each day. This gets tampered down with the second time trend beginning at 177 making the net effect +4.3 increase per day. 38 outliers were identified which is the key to whole analysis. They are sorted by their entry into the model and really their importance.


Note the Seasonal pulse where the first day becomes much higher starting at period 1639 and forward with an average 3956.8 higher volume.  Thats quite a lot and if you do some simple plotting of the data it will be very apparent.  Day 1 and Day 2 were always low, but over time Day 1 has become more average,  Note the AR1 and AR7 parameters.
Let's consider the day of the week data by building a pivot table.
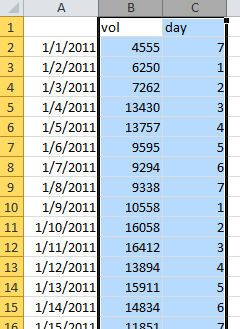
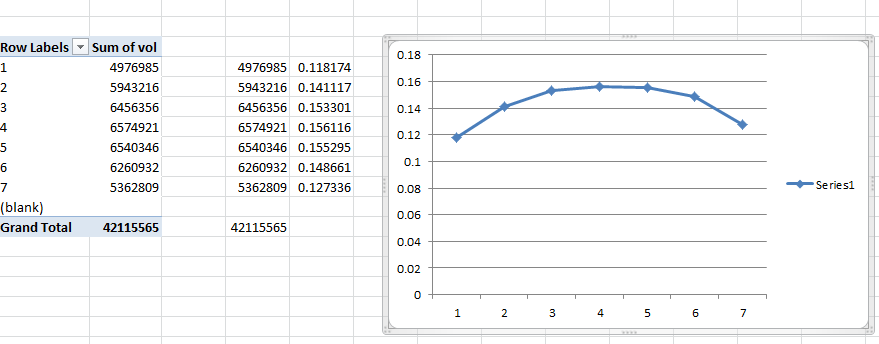
And getting this % of the whole. We call this the contribution %. Day 7 in Excel is Saturday which is low and notice Sunday(baseline) is even lower(remember that the holiday variable had a negative sign? The sign for Saturday was +1351.5 meaning it was 1351 higher than Sunday which matches the plot below. This type of summarization ignores trend, changes in day of the week impacts, etc. so be careful. We call this a poor man's regression because those percentages would be the coefficient if you ran a regression just using day of the week. It is directional, but by not means accurate as Autobox. We use this type of analysis to "roughly verify" Autobox with day of the week dummies, monthly dummies, and day of the month effects using pivot tables. The goal is not to overfit, but rather be parsimonious. Auto.arima is not parsimonious.


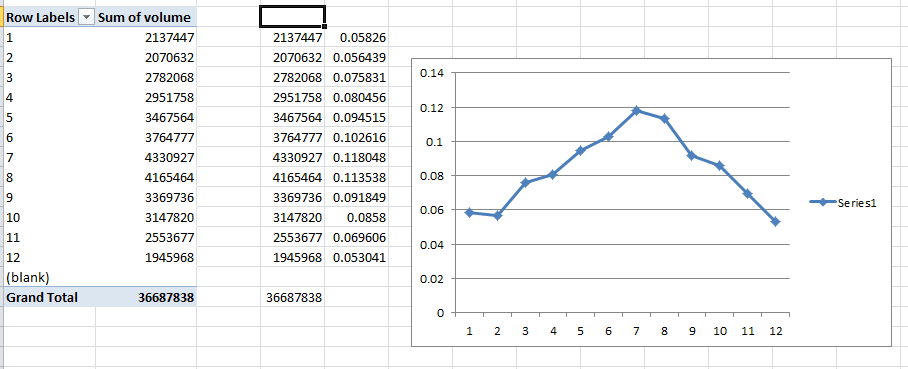
Let's look at the monthly breakout. Jan,Feb,Dec are average and the other months are higher with a slope up to the Summer months and down back to Winter.  The temperature data replaces the use of monthly or weekly dummies here.


We were asked to share our thoughts on advantages and disadvantages of forecasting at monthly vs weekly vs daily levels.

Monthly:

Advantages – Fast to compute, easier to model, easier to identify changes in trends, better for strategic long term forecasting


Disadvantages – If you need to plan as the daily level for capacity, people and spoilage of product then higher levels of forecasting won’t help understand the demand on a daily basis as a 1/30th ratio estimate is clearly insufficient.

Causal variables that change on a frequent basis (ie daily/weekly – price, promotion) are not easily integrated into monthly analysis

Integrating Macroeconomic variables like Quarterly Unemployment requires an additional step of creating splines.


Weekly:

Advantages – When you can’t handle the modeling process at a daily level you “settle” for this. When you have very systematic cyclical cycles like “artic ice extents” that follow a rigid curve and not need for day of the week variations.


Disadvantages – Floating Holidays like Thanksgiving, Easter, Ramadan, Chinese New Year change every year and disrupt the estimate for the coefficients for the week of the year impact which CAN be handled by creating a variable for each.

The number of weeks in a year is subject to change and creates a statistical issue due to the fact that every year doesn’t have 52 weeks. We have seen the need to allocate the 53rd week to a “non-player” week to make the data a standard 52 week period which is workable, but disruptive compared to daily data.

Causal variables that change on a frequent basis (ie daily/weekly – price, promotion) are not easily integrated into monthly analysis

Integrating Macroeconomic variables like Quarterly Unemployment requires an additional step of creating splines.


Daily:

Advantages – Weekly data can’t deal with holidays and their lead/lag relationships. If a holiday has days 1,2,3 before the holiday as very large volume a daily model can forecast that while the weekly won’t be able year in and year out model and forecast that impact as the day of the week that the holiday occurs changes every year.

Daily data is superior for short-term/medium tactical forecasting. Days of the week have different patterns which can be identified at this level. Days of the month also can be identified due to pay schedule. Long weekends, Fridays before holidays on Monday, and Mondays following Friday holidays can be identified as important.

Particular weeks of the month may have an identifiable pattern for build up in anticipation for pay schedules. You would want to use daily data as financial forecasting is often quite inaccurate when they employ “ratio estimates”.

It is quicker at reacting to level shifts and changes in trends as the data is being modeled daily vs waiting a week/month to observe the new data. Companies missed the 2008 financial crises as they were not modeling the data at a daily level. The goal is not just forecasting, but also about “early warning” detection of changes in business demand. This detection can be viewed across all lines of business through the use of reporting on level shifts and pulses from a macro view to flag changes.


Disadvantages – Slower to process, but this can be mitigated by reusing models.

Integrating Macroeconomic variables like Quarterly Unemployment requires an additional step of creating splines.


Go to top