OUTLIER DETECTION AND PLUS/MINUS 3-SIGMA CHARTS
The problem is that you can't catch an outlier without a model (at least a mild one) for your data. Else how would you know that a point violated that model? In fact, the process of growing understanding and finding and examining outliers must be iterative. This isn't a new thought. Bacon, writing in Novum Organum about 400 years ago said: "Errors of Nature, Sports and Monsters correct the understanding in regard to ordinary things, and reveal general forms. For whoever knows the ways of Nature will more easily notice her deviations; and, on the other hand, whoever knows her deviations will more accurately describe her ways." [ II 29]
Some analysts think that they can remove outliers based on abnormal residuals to a simple fitted model sometimes even "eye models". If the outlier is outside of a particular probability limit (95 or 99), they then attempt to locate if there is something missing from model. If not, it's gone. This deletion or adjustment of the value so that there is no outlier effect is equivalent to augmenting the model with a 0/1 variable where a 1 is used to denote the time point and 0's elsewhere. This manual adjustment is normally supported by visual or graphical analysis ... which as we will see below often fails. Additionally this approach begs the question of "inliers" whose effect is just as serious as "outliers" . Inliers are " too normal or too close to the mean" and if ignored will bias the identification of the model and its parameters. Consider the time series 1,9,1,9,1,9,5,9 and how a simple model might find nothing exceptional whereas a slightly less simple model would focus the attention on the exceptional value of 5 at time period seven.
To evaluate each and every unusual value separately is inefficient and misses the point of intervention detection or data-scrubbing. A sequence of values may individually be within "bounds" but collectively might represent a level shift that may or may not be permanent. A sequence of "unusual" values may arise at a fixed interval representing the need for a seasonal pulse "scrubbing" . Individual values may be within bounds but collectively they may be indicative of non-randomness. To complicate things a little bit more , there may be a local trend in the values. In summary there are four types of "unusual values" ; 1. Pulse, 2. Seasonal Pulse, 3. Level Shift and 4. Time Trends .
In order to assess an unusual value one need to have a prediction. A prediction requires a model. Hopefully the model utilized is not too simple , just simple enough.
The Original Data May Be Contaminated With Outliers
An original time series plot, example shown below, is a chronological or sequential representation of the readings. The mean is computed and the standard deviation is then used to place (+ / - ) 3 standard deviation limit lines. These are then super-imposed on the actual data in order to assess what a reasonable spread or variation should be. Outlier points ( points above or below 3 standard deviations ) are immediately identified and thus may be deleted from the next stage of the analysis.
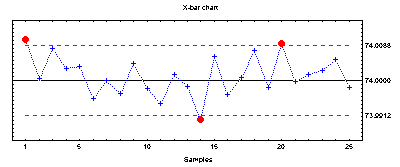
The flaw in the above logic is obvious. Outliers wiil distort the computation of the standard deviation thus inflating the standard deviation and masking the exceptions. Thus we need to simultaneously determine the process standard deviation and the outliers. This problem is exacerbated when you have autocorrelated data as this has an effect on the standard deviation.
If the data is negatively autocorrelated, i.e. high then low then high etc., the standard deviation is overstated. Similarly, if the data is positively autocorrelated i.e. slow drifts on either side of the mean the standard deviation is understated.
Some would argue that the outliers can be identified via an "influential observation approach" or "cook's distance approach". Essentially this detection scheme focuses on the effect of its deletion on the residual sum of squares. But this approach usually fails because the outlier is an "unusual value" to its prediction and that prediction requires a model. Consider the following series. Are there outliers in this series ? Can you identify how many and where they are ? This is an annual series measuring fish population in a Finnish lake.
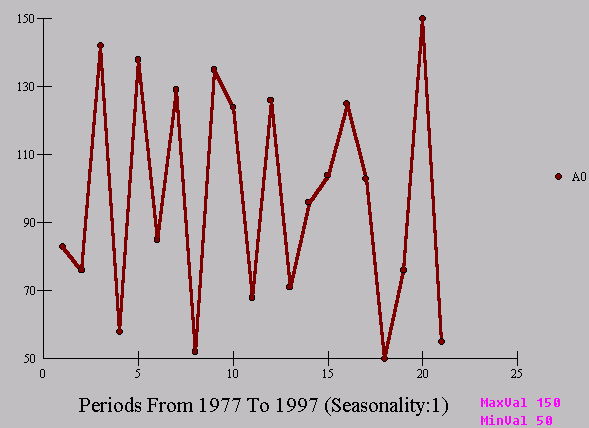
The mean and basic statistics are reported. Note the estimate of the standard deviation 32.1857 .
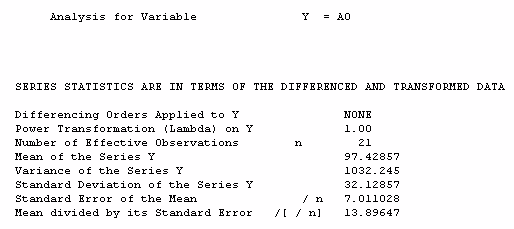
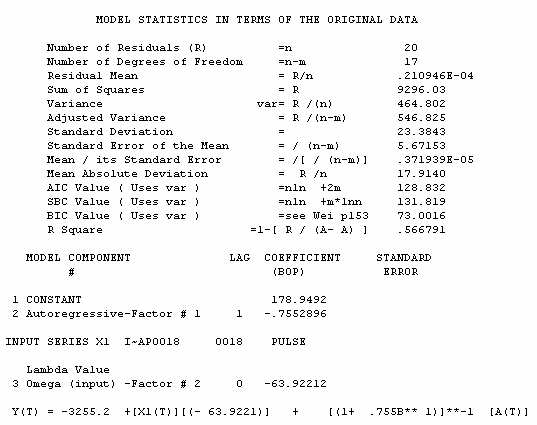
A model is developed which is simply an autoregressive model of order 1. This leads to the identification of the unusual value at time period 18 (1994). This then leads to a robust estimation of the standard deviation 23.3842 as compared to 32.1857 . This dramatic reduction in the standard deviation is due to two effects viz. the autocorrelation in the entire series and the impact of the anomalous data point at time period 18. We show here these results. This illustrates the idea that two gaussian assumptions were violated but can be fixed. The two assumptions were independence and constancy of the mean.
The suggested procedure is the simple intervention in which an extra parameter is added for the mean of the observation in question. By searching for those observations justifying this treatment AUTOBOX augments the simple ARIMA structure.
It is sometimes useful to plot the actual series and the outlier adjusted series on the same grid. Recent econometric research has concluded that the adjusted series is more reliable for unit-root tests and various other approaches.
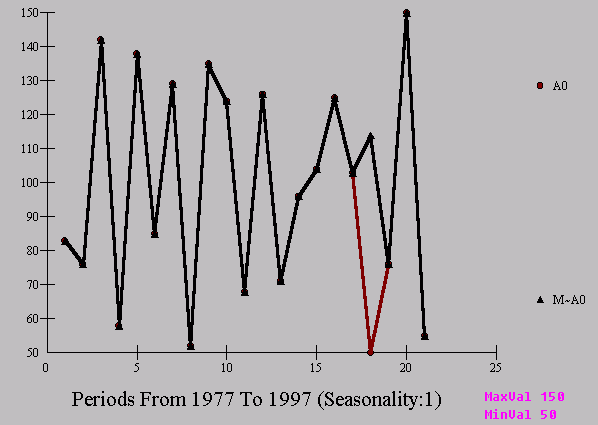
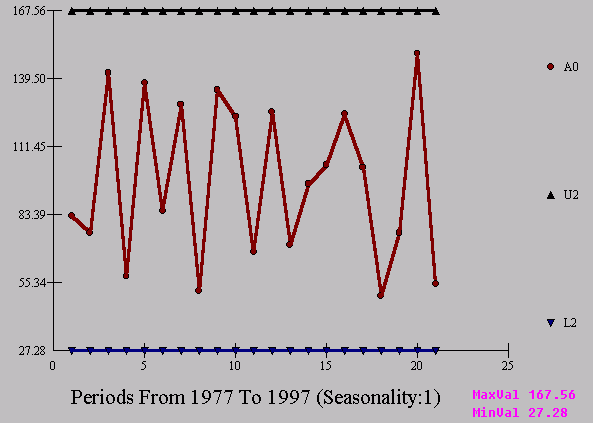
If we compute +/- 3 sigma using 32.1857 as the standard deviation we get rather broad limits. Note that the range is 100 ( MAX-MIN ; 150 - 50 ) and thus the 6sigma rule would give an estimated standard deviation of 100/6 = 16.67 . The large difference between 32.1857 and 16.67 should signal that the gaussian assumptions have been violated in at least 1 way. Note that in this example at least 2 of the assumptions were violated.
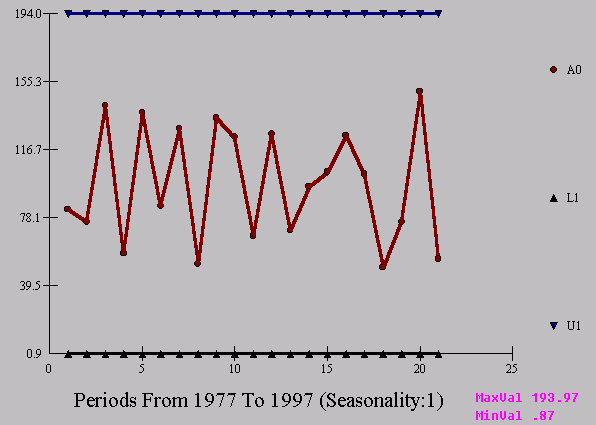
If we compute +/- 3 sigma using 23.3842 we get a much more realistic set of limits.
To further complicate the issue, the whole idea of evaluating each and every point or reading separately is illogical. It is certainly possible and even to be expected that a group or a set of contiguous readings in and of themselves may be within the limits but collectively indicate a paradigm shift.
AFS suggests the following course of action
