SPURIOUS CORRELATION AND IT'S DETECTION
|
Outliers and mean shifts are commonly encountered in time series
analysis. The presence of extraordinary events mislead conventional
time series analysts resulting in erroneous conclusions. The impact of these events
are often overlooked for the lack of a simple yet effective means to incorporate
these isolated events. Autobox performs this task and is thus an "effective means".
|  |
|---|
We first illustrate the effect of unknown
events which cause model identification to go awry.
Standard identification
of Arima models uses the sample ACF as one of the two vehicles for model identification.
The ACF is computed using the autocovariance and the variance. An outlier distorts both
of these statistics and in effect dampens the ACF by inflating both measures.
ACF = AUTOCOVARIANCE/VARIANCE
|  |
|---|
|
In causal models where the cross-correlation function (CCF) is the tool for
identifying the form of the relationship, we have a similar problem.
Outliers in either of the two series inflate the cross-covariance. The net effect is to conclude that the CCF is flat;
and the resulting conclusion is that no information from this potential cause variable is useful.
It is necessary to check that no isolated event or sequence of multiple events has inflated
these measures leading to an "Alice in Wonderland" conclusion where everything appears rosy
and no coorelation is incorrectly concluded.
The effect of outliers is identical in both ARIMA and Causal Models as they inflate
the denominator to a larger degree than the numerator thus driving the ratio
to zero. If not handled properly these outliers will lead to an under-identified model.
|  |
|---|
|
Regression estimates are based upon minimizing the vertical
sum of squares, i.e. the errors in predicting the Y variable.
If unusual values, either in Y or X, are present then the
normal estimators may be biased. Nonparametric, meaning
distributional free, methods have been developed to estimate
parameters that are minimally affected by unusual values.
Modern time series analysis approach yields estimated parameters which are
also "robust", but can parametrically modelled.
|  |
|---|
|
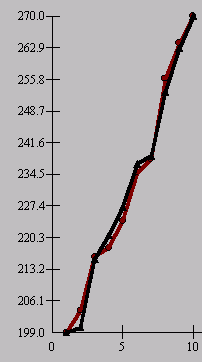
A plot of the data.
|  |
|---|
|
Regression estimates are based upon minimizing the vertical
sum of squares, i.e. the errors in predicting the Y variable.
If unusual values, either in Y or X, are present then the
normal estimators may be biased. Non-parametric, meaning
distributional free, methods have been developed to estimate
parameters that are minimally affected by unusual values.
|
|---|
|
The two unusual values (first and last) distort the correlation and cloud
the true association. The estimated correlation is .079.
|  |
|---|
|
The effect of the outliers is to distort the estimated parameters.
|  |
|---|
|
Outlier detection or Intervention Detection is functionally equivalent
to non-parametric regression when we restrict Intervention Detection to
pulses. In many cases the pulses are systematic, i.e. every s periods or
grouped together in time so that collectively they violate the gaussian
assumptions. Essentially, a sequence of outliers may in and of themselves
not be significant, but collectively they may indicate a non-randomness.
Intervention Detection sorts out the nature of the
of the outliers. Again a consecutive sequence of outliers that have
approximately the same magnitude and direction are collectively referred
to as a step or level shift.
|  |
|---|
|
In this case two outliers are found , the first at time period 1 and the
second at time period 10.
|  |
|---|
|
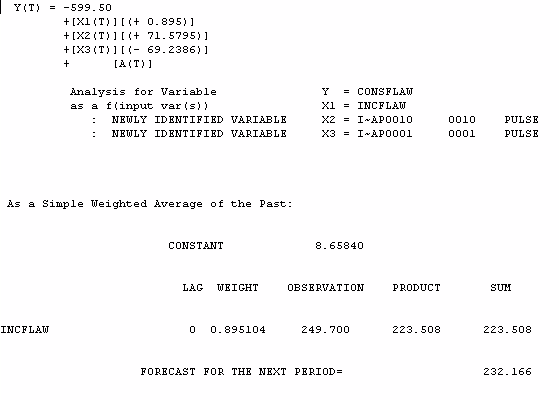
The final equation shows the estimates of the two pulses at time periods
1 and 10 . By identifying these interventions we obtain a more
accurate representation of the underlying relationship between Consumption (Y)
and Income (X).
|  |
|---|
|
The data.
|  |
|---|
CLICK HERE:Home Page For AUTOBOX


