< HTML>
A SEASONAL PULSE IN TIME SERIES ANALYSIS
UNUSUAL VALUES WHICH ARISE AT USUAL INTERVALS
- Consider a case where the true but unknown model is:
Y(t) = v0*X(t) + v1*I(t=to) + A(t)
where A is an i.i.d. ( gaussian ) error distribution
I(t=to) is an Intervention Variable such that
I(t) = 0 for t where MOD(t,s) <> 0
I(t) = 1 for t where MOD(t,s) = 0
and where the current tentative, albeit incorrect model is
Y(t) = v0*X(t) + e(t)
thus we have a case where
e(t) = v1*I(t=to) + A(t)
It is clear that if we correlate e(t) and I(t=to)
we will identify a statistically significant relationship
which will then lead to the required augmentation strategy.
The strategy is then clear, for all possible or candidate
"new variables" such as the I(t=1), I(t=2),....I(t=n)...etc. compute
partial correlations which will measure the expected impact of
the trial candidate. Select that one which has maximum correlation.
This is equivalent to selecting the point in time where the most
ssignificant seasonal pattern of absolute residuals started.
These approaches to developing new variables from model implied series have had outstanding success
with time-series data.
Sometimes the Intervention Variable is referred to as a Seasonal Pulse, for example
(0,0,0,1,0,0,0,1,0,0,0,1,0,0,0,1) for a quarterly series.
Note that the Seasonal Pulse does not necessarily start at the true
beginning of the series (0,0,0,0,0,0,0,0,0,0,0,1,0,0,0,1) .
UNUSUAL VALUES
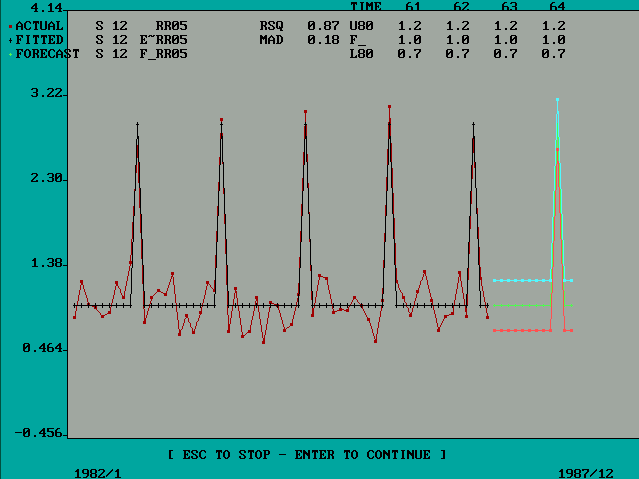
Sometimes the unusual values occur every S periods. This can happen when a
particular effect ( e.g. plant shutdown or a large order is filled at a particular month ) occurs at a fixed point in time.
If the unusual value occurs every S periods it is then not unusual at all.
One analyst's noise is another analyst's signal.
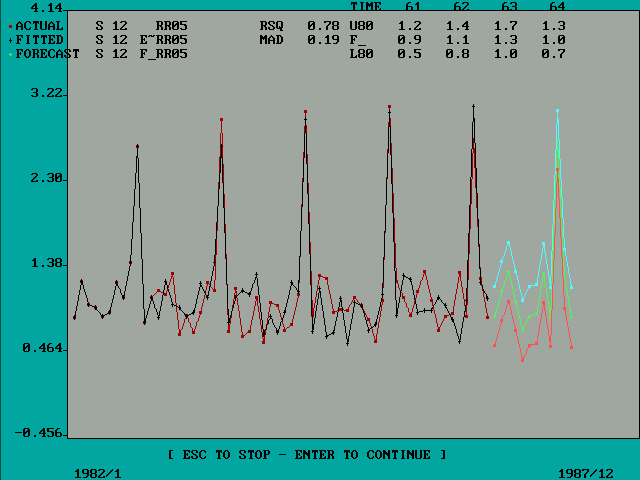
We illustrate this phemomena in a non-causal example of some 60 month's of data.
The problem or opportunity can easily arise in a causal model.
In order to illustrate the need for models that contain seasonal dummies,
we will contrast it to an ARIMA model which inadvertently pushes the
seasonal structure on all months.
Modern analysis tools can generate computer simulatioms which can correctly
assess which is more appropriate.

